Lake Level Data
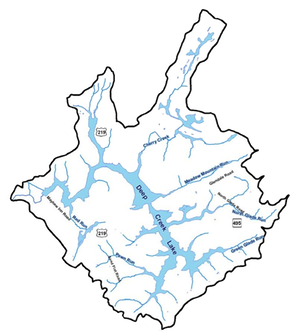
DeepCreekHydro(Brookfield) monitors the lake level on a frequent basis. The current lake level measurement is reported on their website. The measurement, as reported on their website, appears to be made at basically 5 or 10 minute intervals. Longer records than a single measurement are often needed to perform various analyses. The following graph displays the lake level history for the past seven days.
Lake Levels for the Past 7 Days
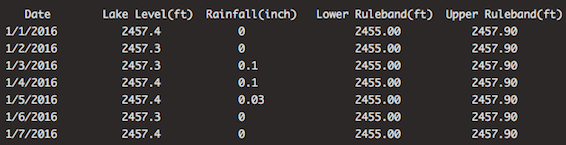
Brookfield does report daily average lake level in their annual reports. It's not obvious how they measure the average and how they treat missing data. Here are the daily average lake levels as extracted from their annual reports. The following is an image of the first few records of one of these files:
- 1994 daily average lake levels Click here for a graph
- 1995 daily average lake levels Click here for a graph
- 1996 daily average lake levels Click here for a graph
- 1997 daily average lake levels Click here for a graph
- 1998 daily average lake levels Click here for a graph
- 1999 daily average lake levels Click here for a graph
- 2000 daily average lake levels Click here for a graph
- 2001 daily average lake levels Click here for a graph
- 2002 daily average lake levels Click here for a graph
- 2003 daily average lake levels Click here for a graph
- 2004 daily average lake levels Click here for a graph
- 2005 daily average lake levels Click here for a graph
- 2006 daily average lake levels Click here for a graph
- 2007 daily average lake levels Click here for a graph
- 2008 daily average lake levels Click here for a graph
- 2009 daily average lake levels Click here for a graph
- 2010 daily average lake levels Click here for a graph
- 2011 daily average lake levels Click here for a graph
- 2012 daily average lake levels Click here for a graph
- 2013 daily average lake levels Click here for a graph
- 2014 daily average lake levels Click here for a graph
- 2015 daily average lake levels Click here for a graph
- 2016 daily average lake levels Click here for a graph
The above data were extracted from the Deep Creek Hydro Project's annual reports. For completeness, these reports can be downloaded from this website by clicking on any of the links below
The author of this website has dedicated a Mac computer in his basement to "scrape," every 10 minutes, the home page of the DeepCreekHydro website and accumulated various data sets. They are cleaned up, with erroneous measurements deleted, and provided as text files above.
- 1994 - Deep Creek Hydro Annual Report
- 1995 - Deep Creek Hydro Annual Report
- 1196 - Deep Creek Hydro Annual Report
- 1997 - Deep Creek Hydro Annual Report
- 1998 - Deep Creek Hydro Annual Report
- 1999 - Deep Creek Hydro Annual Report
- 2000 - Deep Creek Hydro Annual Report
- 2001 - Deep Creek Hydro Annual Report
- 2002 - Deep Creek Hydro Annual Report
- 2003 - Deep Creek Hydro Annual Report
- 2004 - Deep Creek Hydro Annual Report
- 2005 - Deep Creek Hydro Annual Report
- 2006 - Deep Creek Hydro Annual Report
- 2007 - Deep Creek Hydro Annual Report
- 2008 - Deep Creek Hydro Annual Report
- 2009 - Deep Creek Hydro Annual Report
- 2010 - Deep Creek Hydro Annual Report
- 2011 - Deep Creek Hydro Annual Report
- 2012 - Deep Creek Hydro Annual Report
- 2013 - Deep Creek Hydro Annual Report
- 2014 - Deep Creek Hydro Annual Report
- 2015 - Deep Creek Hydro Annual Report
- 2016 - Deep Creek Hydro Annual Report
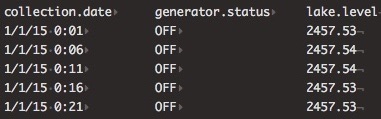
A complementary and more complete set of 10 minute data are provided here courtesy of Jeff Leeks who conducted a similar effort for the years 2012 through 2016. The following is an image of the first few lines of one of the files to better understand the tab-delimited layout of the extracted from the raw files he provided:
- 2012 - 10 minute lake levels Click here for a graph
- 2013 - 10 minute lake levels Click here for a graph
- 2014 - 10 minute lake levels Click here for a graph
- 2015 - 10 minute lake levels Click here for a graph
- 2016 - 10 minute lake levels Click here for a graph
- Most of the reports can be found on the document archives of the Deep Creek Watershed Management Plan work.