Curve Fits of Pareto Distributions to the Annual Dry Period Strings
The Pareto distribution is a probability distribution that seeks to describe quantities which have a particular property: namely, that a few items account for a lot of it and a lot of items account for a little of it.
The Pareto distribution is named after the Italian civil engineer, economist, and sociologist Vilfredo Pareto.
The Pareto distribution is a heavy tailed distribution. In insurance applications, heavy-tailed distributions are essential tools for modeling extreme loss.
Here we're considering the use of the Pareto distribution to model when extreme periods of dry weather, periods with no rain, might occur. Knowledge of such should allow us to better predict when water releases should be planned.
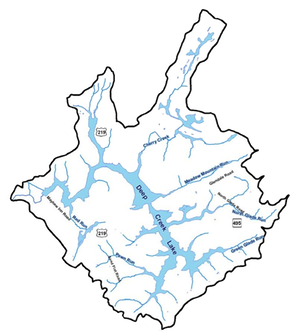
The following graphs are curve fits to the 'dry periods,' the number of days that there was no precipitation, as recorded by the USGS gage in Accident, MD. The fits were done with different methods that were available in "R." To find out more, Google 'Pareto distributions' and one should find plenty of information.
Note that each of the pdf files has four graphs.
- Pareto distributions for 2011 dry periods. - Data are here.
- Pareto distributions for 2012 dry periods. - Data are here.
- Pareto distributions for 2013 dry periods. - Data are here.
- Pareto distributions for 2014 dry periods. - Data are here.
- Pareto distributions for 2015 dry periods. - Data are here.
- Pareto distributions for 2016 dry periods. - Data are here.