The Data Vault
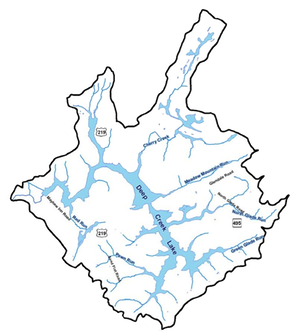
The computer model of the watershed must be supported by valid data, or at least, data that is appropriate to the task at hand. This webpage summarizes the activities and results associated with the collection of data and maintaining a repository of such.
Collecting, cleaning, and archiving are three important functions associated with valid data. Data collecting can be from instruments, websites, reports, or provided by other parties. Data cleaning is to make sure that the numbers pass sanity tests. Data archiving is about presenting the clean data in a format that anyone can process. A detailed description of how I go about providing valid data sets for the various data types is provided here. Do check it out.
NOTE: Next to the file name that causes a download one can click on the button to see a plot of the data. A new window will be opened. The data is plotted using 'dygraphs.' Details of this approach can be found here.
The graph is interactive. You can mouse over the graph to highlight individual values (see upper right hand corner). You can click and drag to zoom to see a small interval. Double-clicking will zoom you back out. Shift-drag will pan. Each graph can be adjusted by YOU by specifying a rolling average. The rolling average can be set using the text box in the lower left-hand corner of the graph.
The following is a list of ongoing data collection projects.
Resources:
- Most of the reports can be found on the document archives of the Deep Creek Watershed Management Plan work.
Resources for Evaporation:
- Most of the reports can be found on the document archives of the Deep Creek Watershed Management Plan work.