Solids
Summary
Levels of total suspended solids (TSS) or particulate matter are good indicators of stream health. High concentrations of TSS can ruin habitat for fish and other aquatic life by increasing sedimentation and siltation and provide attachment places for pollutants such as metals and bacteria. An inventory project used GIS should be used to gather field data on the watershed for implementing stormwater management controls to lessen TSS load.
The Federal Clean Water Act (CWA) requires that States review their water quality standards (WQS) every three years (Triennial Review) and revise the standards as necessary. A water quality standard consists of three parts:
- Designated Uses that set goals for a water body. Examples are support of aquatic life, drinking water supply or a cold-water fishery such as trout.
- Criteria that support the designated uses - There are numerous criteria for chemical substances, bacteria, acidity and physical characteristics (e.g., temperature). Examples include dissolved oxygen sufficient to support aquatic life or metals in sufficiently low concentrations that they will not interfere with aquatic life.
- Anti-degradation policy - Maryland has a policy in place, and updates the list of high quality waters each triennium as needed.
The Maryland water quality standards are found in the Code of Maryland regulations (COMAR) at 26.08.01 – 26.08.02.
Details about the various requirements and applications can be found on the Maryland Department of the Environment website.
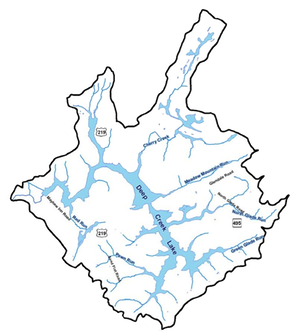
The known water quality data that has been collected for Deep Creek Lake by Garrett County Health Department consist of the following
- Secchi depth measurements (i.e., the depth of light penetration measured with a standard black-and-white disk) at four locations collected monthly May through September from 1993 to 2003. Secchi depths range from 2.5 to 19 feet with an average depth of 8.8 feet.
- Nitrate levels at one location collected sporadically May through August from 1994 to 2003. Concentrations range from 0.0 to 0.4 mg/L and are reported with a high detection limit.
- Nitrate and phosphate levels at three locations collected monthly May through September from 1993 to 2003. Nitrate concentrations range from 0.0 to 0.6 mg/L and phosphate concentrations range from 0.0 to 0.2 mg/L. Both nitrate and phosphate have average concentrations less than the usual detection limit of 0.2 mg/L.
- pH measurements at 21 stations collected monthly May through September in the years 1988 through 2001 and 2003. These data were not used in the present water quality study.
- Fecal coliform data at 21 stations collected monthly May through September from 1993 to 2003. Fecal coliform concentrations range from 0 to 1986.3 #/100mL. Also included in these data are monthly total coliform measurements from May to September in the years 1995 and 1996. Total coliform concentrations range from 0 to 1601 #/100mL. These data were not used in the present study.
Resources:
- Deep Creek Lake, Assessment of Water Quality Impacts from Potential Land Development, Draft February 20, 2007Memorandum from Clive Graham to John Nelson, Feb. 2017
- Maryland: Cherry Creek - Treating Acid Mine Drainage Improves Cherry Creek, EPA, Section 319


