2012 Lake Level and Generator Hours
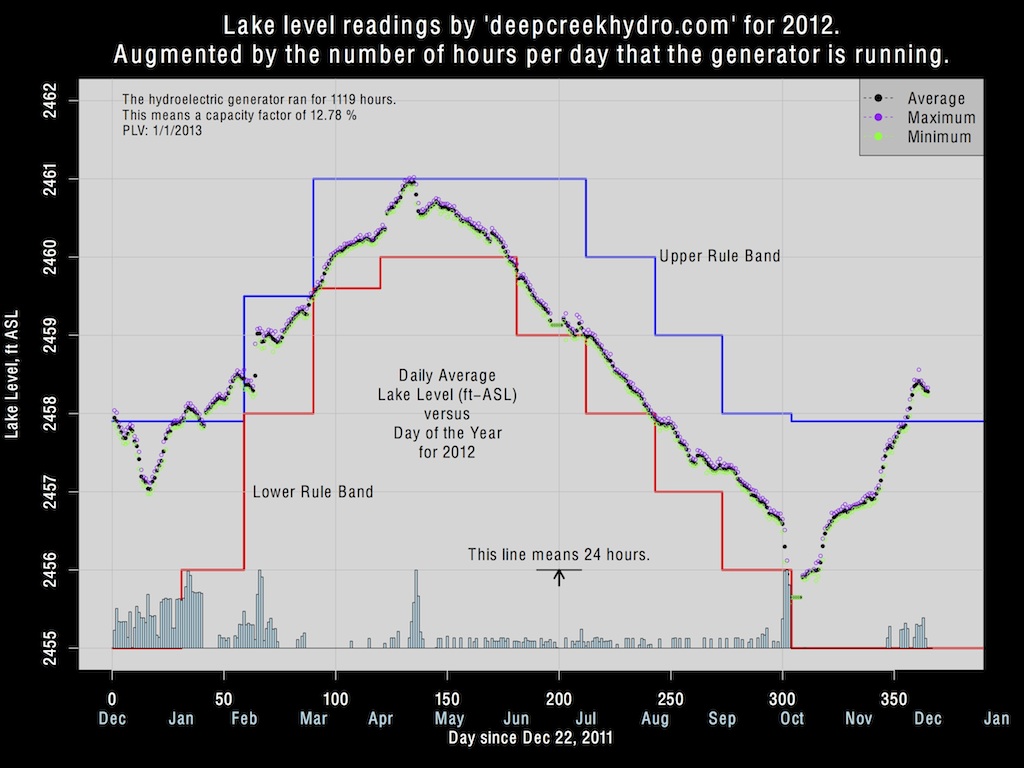
The map shown below displays the daily average, maximum and minimum surface water levels of Deep Creek Lake for the year 2012, and a few days of 2011, together with the hours of operation of the turbines and the current Lower and Uper Rule Band. The 2011 data are included for completeness since it defines the project's start of collecting the data from the deekcreekhydro website. The data is extracted from deepcreekhydro every 10 minutes. That was an initial choice, making a guess at the sampling time of deepcreekhydro. It turns out that the data is updated every 5 minutes, but the 10 minute sampling interval was retained.
The chart contains daily average values from the beginning of record taking, 22 Dec, 2011, until Dec 31, 2012, mid afternoon.
The generator status is computed from the number of hours that the data indicates that it is "running." That's the only inormation available. It is therefore assumed that the generators are running at full capacity.

The scalable pdf file of this image can be downloaded by clicking on the image above.


